Exploring raster (Sextante)
back to New User Guide Index page
Introduction
OpenJUMP, 'since version NB 4397', allows to explore data information of raster (loaded via Sextante imagery) in different ways.
Tooltip
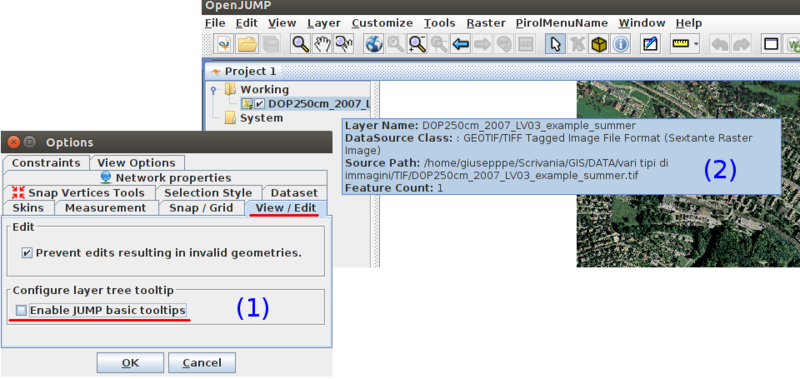
Layer tooltip can be used to explore Sextante raster layers about some basic information
On menu Customize click on Option>View/Edit panel and disable the option Enable JUMP basic tooltip(1).
Than moving the cursor over a Sextante Raster Image in the layer tree will show more information about layer name, datasource class and source path (2).
Raster Layer Info
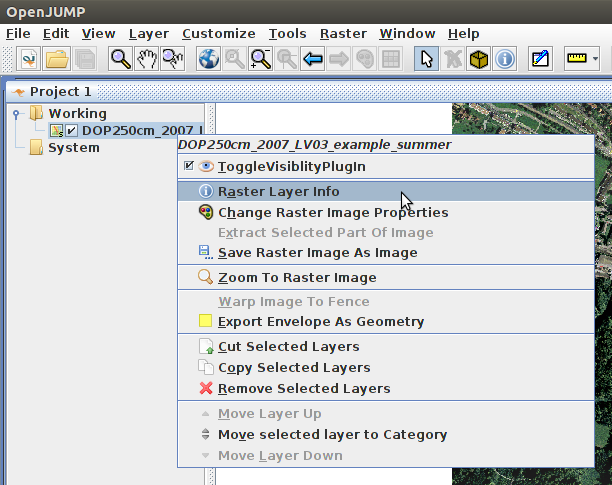
Select a Raster Image layer on layer tree and left click to enable Raster Layer Info.
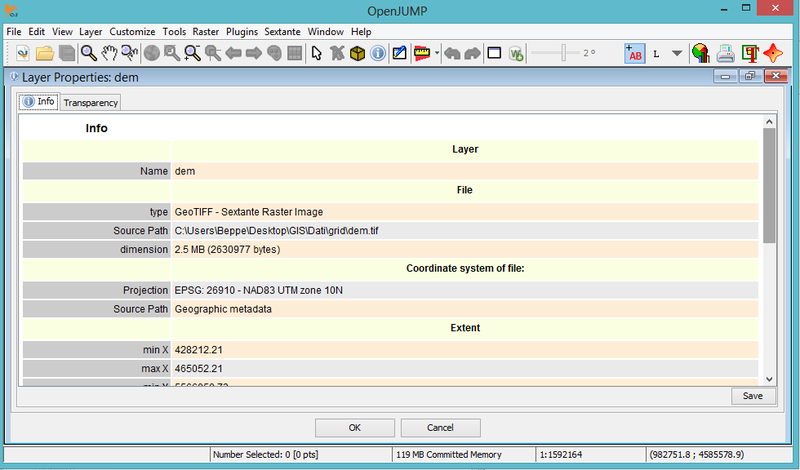
An info panel will popup with two subpanels:
A panel about File sourcepath and dimesion, raster extension and raster type.All Raster information (including statistics one) are grouped into an unique panel called Info, it provides also a Coordiante Reference System check for Geotiff or raster with auxiliary files (.prj or .aux).
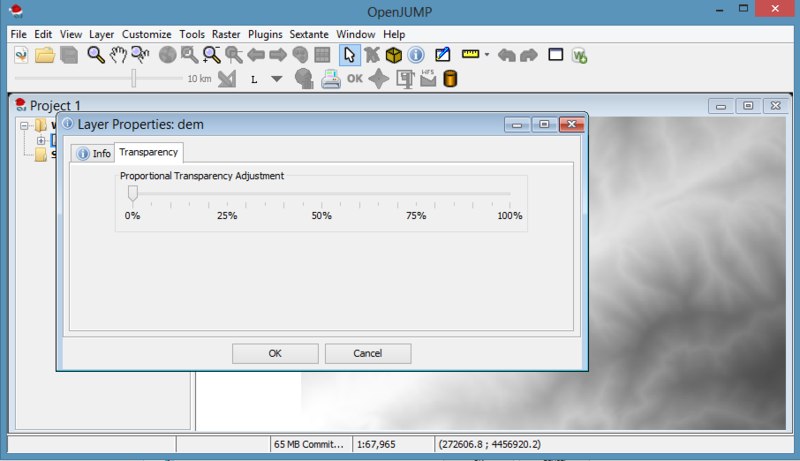
A second panel is used to define transparency parameters
Pixel Inspection
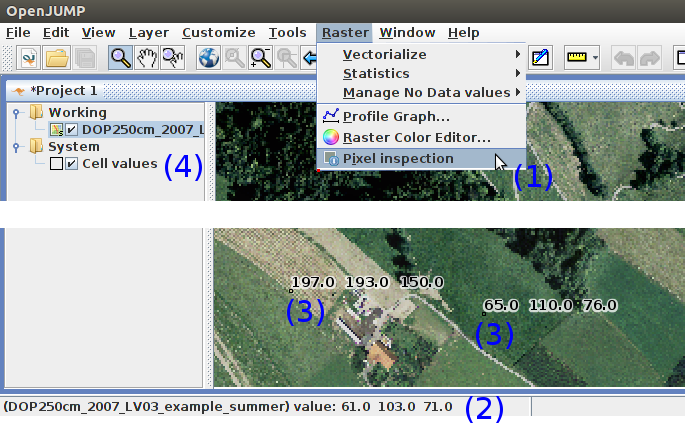
Pixel inspection (1) , enabled via Raster menu is a powerfull tool to inspect single values of a raster cell.
By moving the cursor over a the raster, single cell value is displayed on the left side of lower system panel (2).
Clicking on the view will display the cell value (3). Values are saved on a temporary vector layer (4).
Raster Statistics
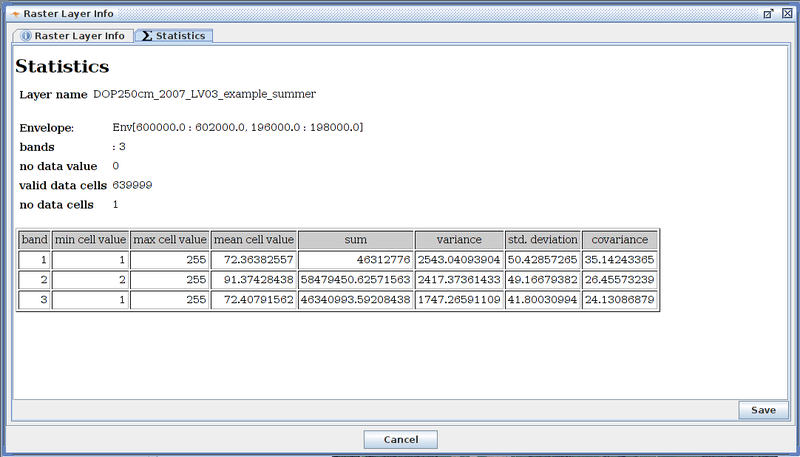
On menu Raster>Statistics>Compare selected Grid raster layers there is a panel that calculates and compare cell statistics of selected raster layer (min, max, mean, ect) per band. Alpha chanel will be displayed as band number 4.
The information are saved as table into Result viewer where can be explored and eventually saved as .CSV file
Profil Graph
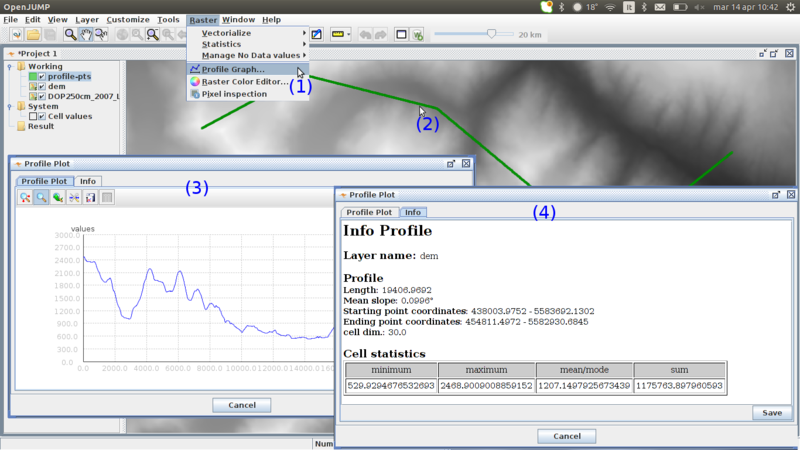
Profil Graph allows to generate a profile on a Sextante raster.
Click on Raster>Profil Graph tool (1). Draw a line on the top of the raster following the profile that you want to inspect (2).
An info panel will popup with two subpanels:
(3) The Profile plot and (4) an Info panel with all the info connected to that profile: length, max/min altitude, mean altitude, mean slope, ect.
Compare Grid Raster Layers
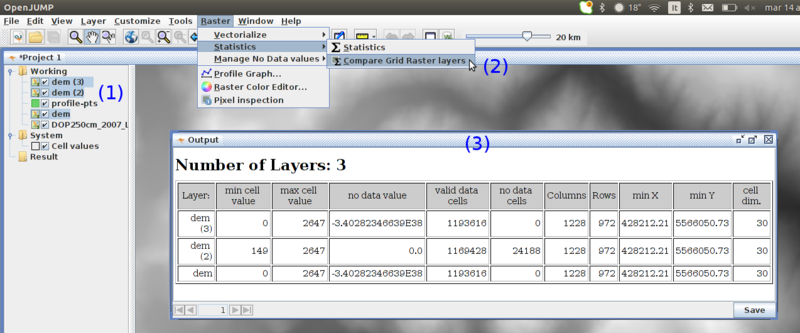
'Compare Grid Raster Layers' works only with single band raster layers. It allows to compare different selected raster layers to compare different informations (max/min cell values, nodata cell values, number of valid cells, number of nodata cells, number of columns/rows, min x/y, cell dimension).
Select one or more single raster layers (1). Click on Raster>Statistics>Compare Grid Raster Layers (2). An Info panel will display all the info in a table (3).
Last modification: 2016_6_14